IoT Traffic Capture and Analysis on AWS

I work with different IoT protocols and their embedded clients every day, and troubleshooting product issues in the field can be tricky. When the steps to reproduce a problem aren’t clear, I like to capture the traffic during the issue. This helps me see what’s actually happening and how the client and server are interacting.
But getting a proper Wireshark capture file is tricky for two main reasons:
- First, getting one on the client side, which is remote and constrained and the property of the end customer, is either complicated or impossible in some cases.
- Capturing traffic on the cloud/server side is challenging due to the traffic volume and the deployment’s distributed nature: the load balancer and the protocol frontends are deployed as multiple machines (clusters).
One solution I started to use within AWS environments is mirroring VPC network traffic. As part of its networking features, AWS proposes to copy and funnel the traffic of some network interface (ENI). In practice, it pipes the traffic of some ENI to a target one, following some filtering rules. For example, you take all the UDP, CoAP (or MQTT) traffic, incoming or outgoing, from your protocol frontend machines (or load-balancer), duplicate it, and encapsulate it in another protocol called VXLAN and send it to a target network interface of a given machine.
In a nutshell, VXLAN is a protocol that encapsulates Ethernet frames in UDP packets. It’s used for various tasks, like extending virtual networks or VPNs. In our case, the AWS traffic mirror uses it to capture and transfer network packets to another network interface.
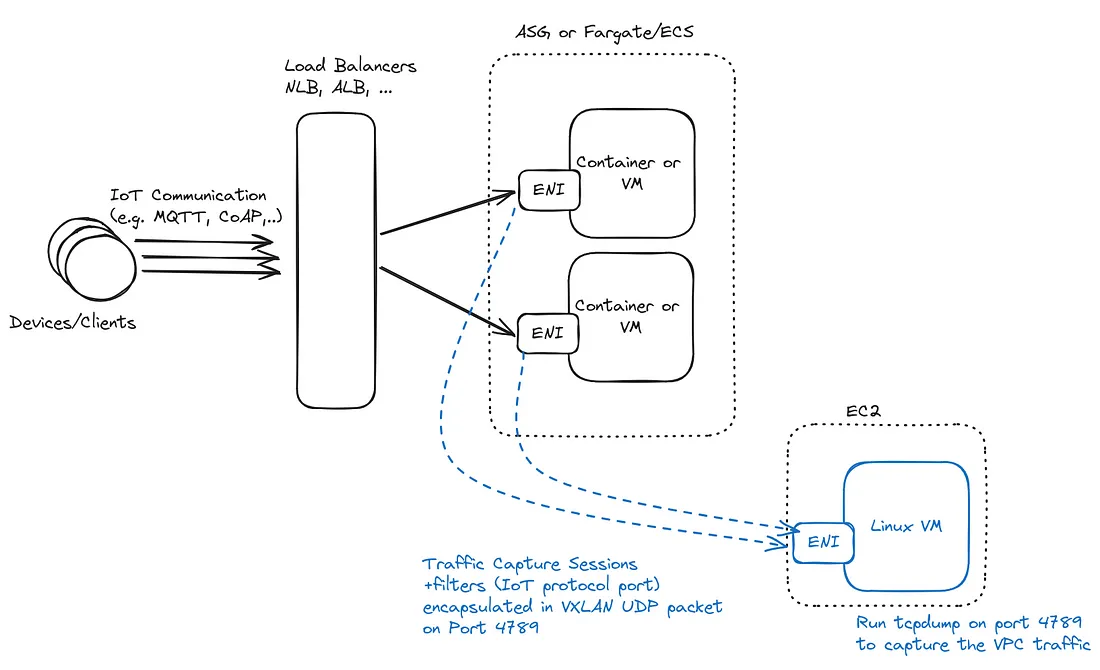
Now we receive the traffic on a machine. Before doing any analysis, we want to archive some of the traffic. The idea is to be able to look back in time to find the network traces of when a bug occurred.
In the first days or months of deployment, the archive’s overall size probably fits on a regular disk. This is especially true with IoT protocols and applications, where you are conservative about the protocol footprint and the overall bandwidth.
We can use the good old tcpdump with file compression and rotation options. This tool’s less-known feature is that it can write, compress, rotate, and delete capture files like we usually do with logs file.
Note: there is a bug in some tcpdump versions packaged by some distribution (e.g., AWS Linux); tcpdump changes user/group during its operation: start as root, change to tcpdump, then back to root. One way to workaround is to set your capture directory owner and group as:
mkdir /var/capture
chown root/var/capture
chmod 770 /var/capture
Then run :
tcpdump -i eth1 -C 200 -G 86400 -W 25 -w /var/capture/dump_$$(date +%%Y-%%m-%%d-%%H:%%M:%%S).pcap -z gzip -s 0 udp port 4789
Now that our traffic is centralized and stored, we can load it in Wireshark. Well, as soon as the pcap file starts to be in the gigabyte order, it’s barely usable. What I’m doing is pre-filtering with Tshark. First I concatenate the files of the time range where the communication I need is:
mergecap -w merged.pcap dump_2024–08–29–*.pcap*
Now, I either have the IP address of the device I want to inspect or not. If I don’t, I try to figure out its IP address. For CoAP communication over DTLS, I look for the first DTLS handshake containing the PSK Identity.
tshark -r merged.pcap -Y ‘dtls.handshake.identity == D:79:44:65:76:69:63:65’
This will start filtering the pcap file and show the first DTLS handshake packet with this specific, hexadecimal-encoded DTLS Identity. Of course, you can adapt it to other protocols.
Then, based on the IP of the device, I can extract a smaller file limited to the traffic of this IP address:
tshark -r merged.pcap -Y ‘ip.addr == 194.201.54.78’ -w filtered.pcap
This is a quick method to get a smaller file. But it’s still slow to use Shark on gigabytes of pcap files. Shark is a generic tool, so it’s slower than a specialized one for a specific use case. For my example of finding the packets related to a given DTLS Identity, I’m writing a specific small filter in Go using Go-Packet. Here is a code snippet to find a DTLS handshake:
pcapFile := os.Args[1]
handle, err := pcap.OpenOffline(pcapFile)
if err != nil {
  log.Fatal(err)
}
defer handle.Close()
packetSource := gopacket.NewPacketSource(handle, handle.LinkType())
for packet := range packetSource.Packets() {
  recordsByte, err := recordlayer.UnpackDatagram(packet.ApplicationLayer().LayerContents())
  if err != nil {
    fmt.Println("DTLS Unpack datagram error", err)
    continue
  }
  for _, recordByte := range recordsByte {
    // is it an handshake record?
    if len(recordByte) > 0 && recordByte[0] == 0x16 {
      h := recordlayer.Header{}
      err = h.Unmarshal(recordByte)
      if err != nil {
        fmt.Println("Header decoding error", err)
      } else {
         handshakeBytes := recordByte[recordlayer.HeaderSize:]
         if handshake.Type(handshakeBytes[0]) == handshake.TypeClientKeyExchange {
           msg := handshake.MessageClientKeyExchange{}
           msg.KeyExchangeAlgorithm = 2
           err := msg.Unmarshal(handshakeBytes[12:])
           if err != nil {
             fmt.Println("ClientKeyExchange decoding error", err)
           }
           fmt.Println("Identity:", string(msg.IdentityHint), packet.NetworkLayer().NetworkFlow().Src())
         }
      }
   }
 }
 // Print out packet data
 fmt.Println(packet)
}
In conclusion, capturing and analyzing IoT traffic in cloud environments can be challenging. I hope these methods, combining tcpdump and AWS traffic mirror, will help you to simplify debugging client-server interactions.